Gold in the Emerge-Tech Category!
24/08/2021The State of Global eCommerce in 2017
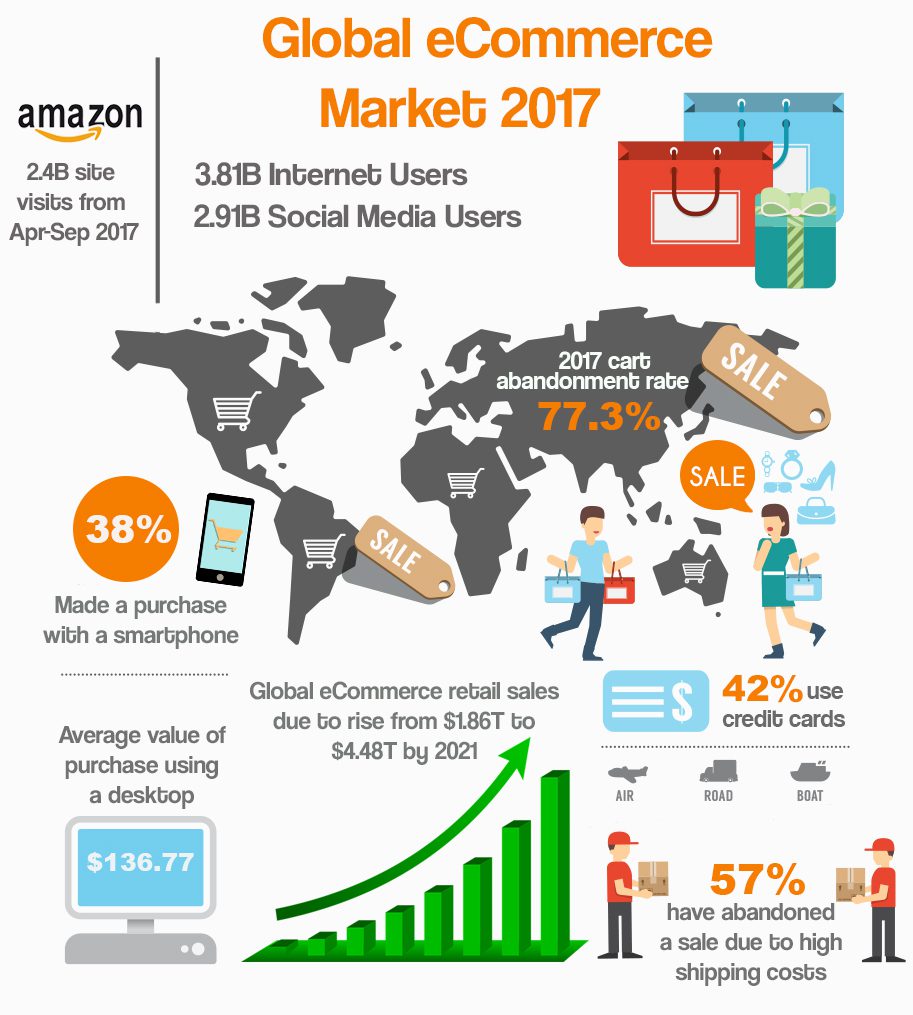
As the year very rapidly draws to a close, it seemed fitting to look back on the last 12 months and document some of the key insights that we learned about the global eCommerce market this year – most of these insights are portrayed in the infographic below…
Internet Usage
As of August 2017, Internet usage hit a staggering 3.81 billion – to add context, this is more than the total number of people in the 5 most populated countries in the world! 2.91 billion people worldwide are also considered to be active users of social media; Facebook, YouTube, and WhatsApp rank in the top 3 respectively. In terms of eCommerce specifically, it’s estimated that global retail sales will increase 18% from last year’s figure of $1.9 trillion.
It is expected that China, once again, will lead 2017’s global eCommerce market, based on a forecasted 24% increase in sales since 2016. Marketplace giant, Amazon, amassed 2.4 billion visits between April and September this year alone, which is not too surprising considering it was the most popular online store in the US during 2016.
Technology
Despite accounting for more than half of all retail site visits worldwide, smartphones only generated 38% of online shopping orders by Q3 of 2017. It’s likely this will increase by the end of Q4, but there is still a lot to be said for desktop surfing!
Cart Abandonment
Perhaps one of the most interesting insights came in the form of statistics for cart abandonment rates – by Q2 of 2017, it was found that more than 77% of all online orders were abandoned. Perhaps linked to the questionably low rate for smartphone orders, sites that aren’t ‘mobile friendly’ can be a huge deterrent for customers to follow through with the purchase journey.
Similarly, it was found that during Q1 of 2017, 57% of over 1,000 survey respondents in the US stated that they had cancelled an online order because of shipping costs being too high. Many studies on cart abandonment have found ‘unexpected shipping costs’ to be one of the biggest culprits in customers dropping off from the purchase process, so perhaps this statistic isn’t too surprising!
Online Payment
Probably least surprising was the discovery of shoppers’ preferred payment methods, with 42% choosing credit cards. PayPal wasn’t far behind at 39%, but it’s clear from the data there still remains a strong reliance on a ‘buy now, pay later’ approach. 3% of shoppers chose cryptocurrencies, such as Bitcoin, as their preferred payment method…though if we had any Bitcoins virtually lying around, I don’t think we would be parting with them any time soon!


