Gold in the Emerge-Tech Category!
24/08/2021The Global eCommerce Market in 2018
It’s no surprise that eCommerce has maintained a steady incline year on year – and 2018 was no different. We saw an increase in the global use of E-wallets, and Black Friday online sales hit $6.22 billion.
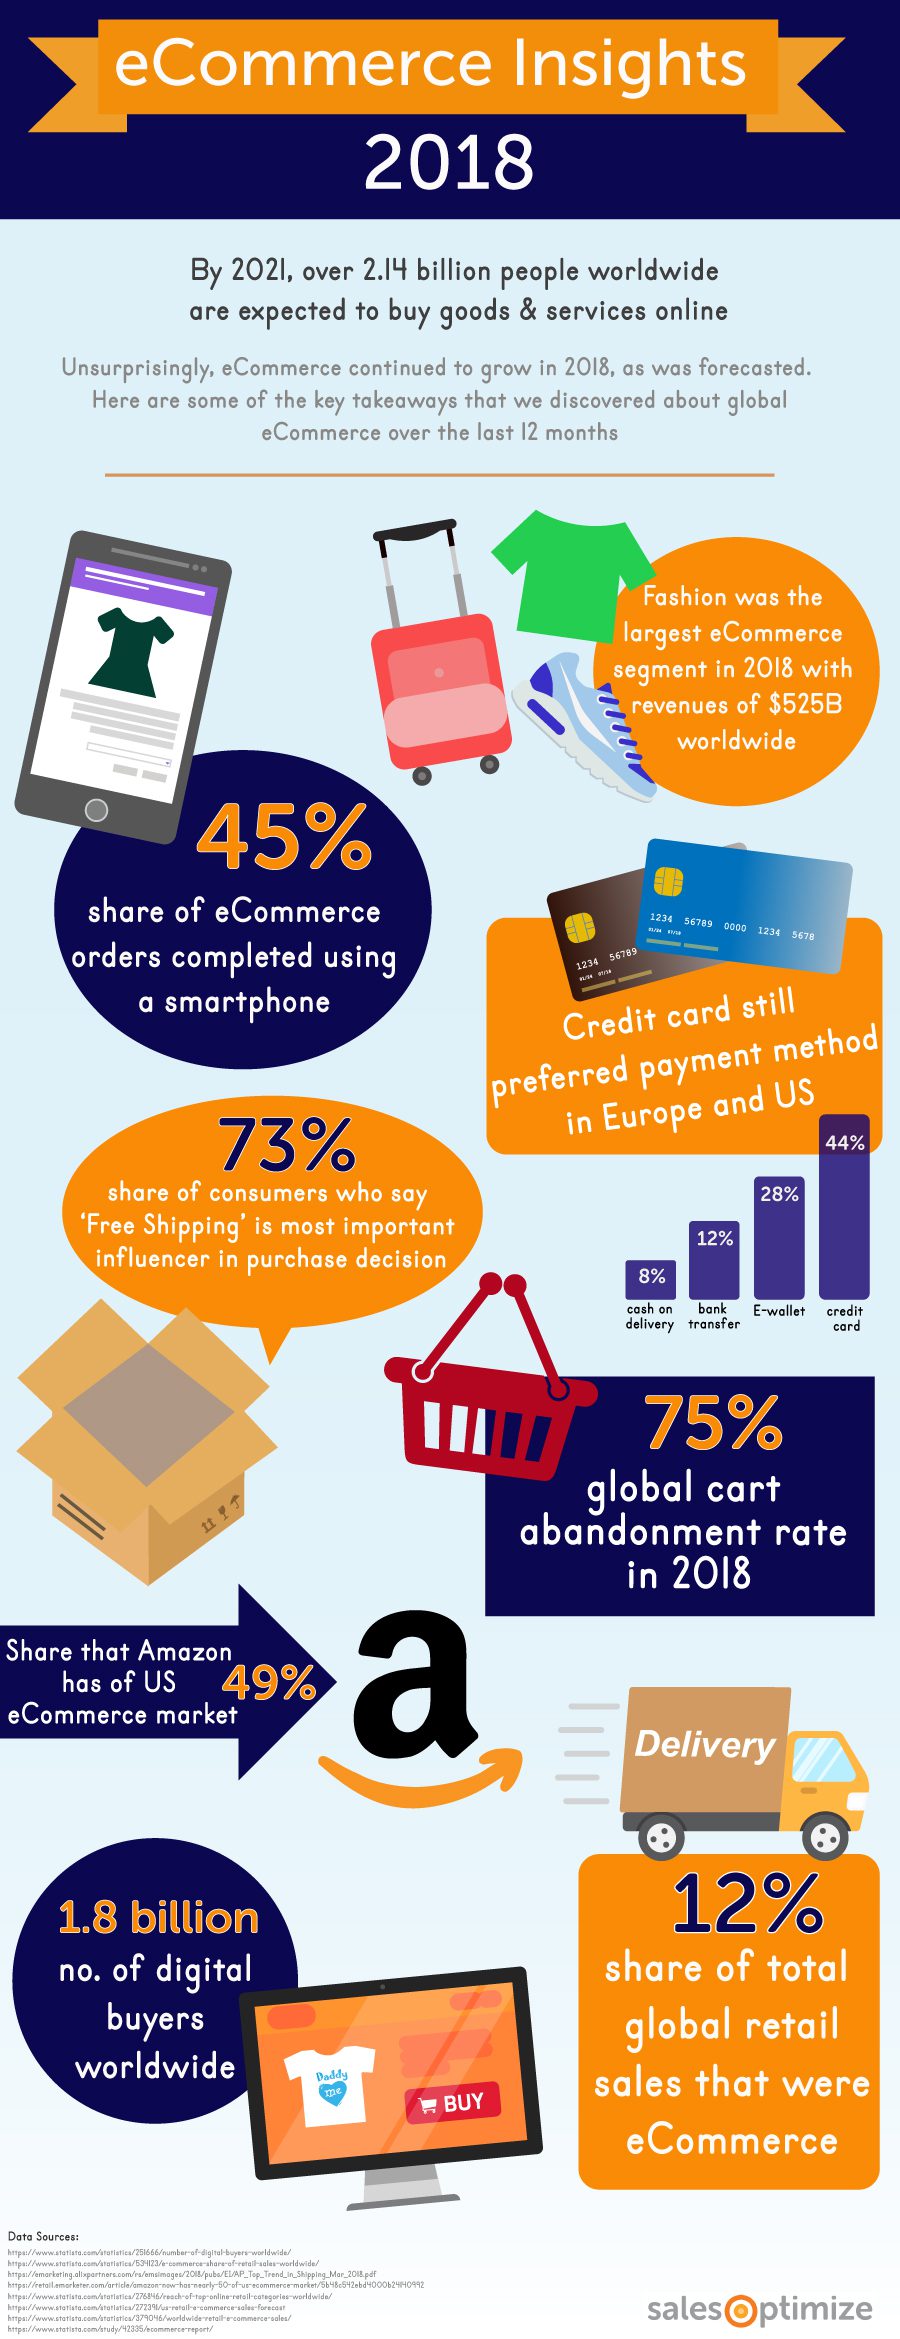
Let’s have a look at some of the most notable trends and statistics from the past 12 months…most of the key insights that we learned about the 2018 global eCommerce market are portrayed in the infographic below.
Digital Buyers
There are an estimated 1.8 billion people in the world who are deemed ‘digital buyers’, i.e. they have purchased goods or services online. By 2021, this number is expected to increase by almost 19% to 2.14 billion (source). 2018 also saw global eCommerce sales estimated to reach $2.8 trillion (source). Perhaps this is expected, given the ease at which consumers can shop electronically; they have access to multiple devices capable of connecting to the Internet, especially when they are on the go.
eCommerce Market Share by Location
China remains to have the largest eCommerce market share globally, and was estimated to be worth US$636 billion in 2018 (source). This is attributed to growing disposable income in the country, as well as rapid economic growth in second & third tier cities – in 2019, China is forecasted to account for nearly 56% of all online retail sales globally.
The United States has the second highest eCommerce market share and generated $505 billion in revenue during 2018, while Europe is considered to have the third highest market share with a revenue figure of $347 billion in the last year (source).
Shopping by Device
Last year we reported that 38% of shoppers had made an online purchase [in 2017] using a smartphone – by Q3 of 2018, that figure increased to 45%. Interestingly, while accounting for less than the number of orders purchased on desktop devices, smartphones had the highest traffic share volume (source). In other words, shoppers seem more inclined to browse eCommerce sites on their mobile phone, but ultimately the purchase event occurs on a desktop computer.
Preferred Payment Methods
In China, the preferred payment method for online purchases is via E-Wallet, capturing 64% of the market in 2018. However, in the US and Europe, debit/credit cards remain the preferred payment method, with a market share of 49% and 41% respectively. It is forecasted that by 2023, E-Wallets will overtake credit cards in popularity and become the most commonly used method to pay for goods and services online in both the US and Europe. Other chosen payment methods include bank transfers and cash on delivery, though these options account for less than 20% collectively. For the time being, the Western world seems to remain firmly loyal to debit/credit cards when making a purchase online (source).
Cart Abandonment
During 2018, the global cart abandonment rate was 75% – although extremely high, this figure is actually 3% less than what it was in 2017. Again, the biggest reason for abandoning transactions appears to be the result of shipping fees – according to ReadyCloud, 61% of shoppers who were surveyed reported abandoning transactions due to high shipping costs. Similarly, in a report by AlixPartners, it was found that 73% of respondent claimed that the availability of free shipping was critical to their purchase decision.
It’s becoming increasingly apparent that free shipping is one of the most important factors during the purchase decision, and with global eCommerce giants such as Amazon controlling almost half of the digital market in the US alone, all the while offering free and quick deliveries to its prime customers, there is definitely reason for smaller retailers to panic – they must be able to compete with the likes of Amazon and offer shoppers a more compelling reason to buy from them instead, particularly when it comes to shipping terms. Hopefully by this time next year we will see a drop in the number of online transactions abandoned because of high shipping costs…


