


If you're running B2B outbound or ABM in 2026 and your targeting still relies on company size and industry code, you're prospecting with a blindfold on. Teams that are pulling ahead are using technographic data, and doing it right.
Businesses using technographic data report 28% higher conversion rates in B2B sales campaigns and are 50% more likely to exceed their revenue goals compared to those using traditional targeting methods.
This is the playbook for actually using it. We'll cover what technographic data is, the use cases that move the most revenue, the signals worth paying attention to, where most platforms fall short, and the practical workflow that turns tech stack intelligence into closed deals.
What is technographic data?
Technographic data is information about the technology a company uses and how they use it.
At its simplest, that means tagging an account as "uses Salesforce" or "runs on Shopify Plus." At its most useful, it means knowing the exact configuration:
- which CRM
- which marketing automation
- which payment processor
- which BNPL provider
- which shipping carrier
- which cloud host
- which observability stack
- when they installed each one
- how they're using them today
The depth matters because surface-level technographics ("uses AWS") tells you very little about whether the account is a fit, whereas deep technographics ("uses AWS for compute, Stripe for payments, Klarna for BNPL, ships internationally via DHL, runs marketing on HubSpot") tells you almost everything.
This is the level TAMI was built to operate at. The platform detects detailed technographic data refreshed in real time rather than crawled quarterly. That's the difference between knowing an account exists and knowing whether it's worth a rep's hour.
What types of technographic data are there?
There are three categories of technographic data worth distinguishing, because each one drives different plays:
Static technographics answer "what do they use right now." This is the foundation, and the most common type sold by data providers.
Behavioural technographics answer "how do they use it." A company that installed HubSpot last year and uses three of its features is a very different prospect from one running HubSpot Enterprise across sales, marketing, service, and CMS. Behavioural depth changes the pitch.
Install and uninstall signals answer "when did this change." These are the highest-intent signals in the category. A company that just churned off Mailchimp is a different opportunity from one that's been on it for five years, and a company that just moved to Shopify Plus is signalling a revenue and ambition shift that almost no other data type surfaces.
Why technographic data matters more than ever
The case for technographic data has hardened over the last two years because of one specific market dynamic: software replacement.
60% of software purchases are replacements rather than new adoptions, which means most B2B sales are now competitive displacements. You're not selling into a vacuum. You're selling against an incumbent. And without technographic data, you don't know who the incumbent is, when they bought it, or whether the prospect is happy with it.
The market for this kind of intelligence reflects how essential it's become.
The technographic data market expanded from $367.1 million in 2020 to $1.17 billion by 2025, a 26.1% compound annual growth rate. Over 80% of businesses now incorporate technographic data into decision-making, with 90% considering it essential for marketing strategies and 75% of B2B marketers relying on it for personalisation.
What does this mean for you?
Translated to the rep level, here's what's actually happening.
Teams that don't use technographics are still sending the same email to every account in a vertical. Teams that do are sending five different versions, each addressing the specific stack the recipient is using, the gap that stack creates, and the case study that's closest to that prospect's setup.
The conversion gap between those two motions is exactly the 28% the research keeps surfacing.
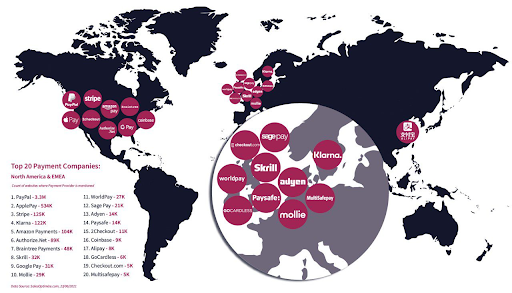
The five highest-impact use cases of technographic data
Technographic data unlocks a lot of plays, but five of them produce the bulk of the revenue impact for B2B teams. Each one builds on the same underlying capability: the ability to slice your TAM by the technology that actually matters to your motion.
1. Competitive displacement
If 60% of B2B software purchases are replacements, the single highest-ROI use of technographic data is identifying every company using your direct competitor and approaching them with a displacement message.
This works because the prospect has already validated the category (they bought a tool like yours), and you only need to win the comparison rather than create demand from scratch.
The play is straightforward in principle:
- pull every account in your TAM using competitor X
- segment by tenure on the tool (the longer they've been on it, the more switching cost they've absorbed but also the more frustration may have built up
- pair the list with a campaign focused on the specific gaps your product closes.
The execution depends entirely on data freshness. A list of "Cognism users" that's six months old is mostly noise, because churn and switching happen constantly in B2B SaaS. Real-time technographic refresh is what makes this play repeatable rather than a one-off project.
2. Ideal customer profile refinement
Most ICPs are written in soft criteria: "mid-market B2B SaaS in North America." That description fits 30,000 companies and is useless for prioritisation.
Technographic data turns soft criteria into hard filters. The same ICP, expressed technographically, becomes "Shopify Plus merchants doing over £2M GMV, using Klarna for BNPL, shipping internationally, with HubSpot Enterprise as their marketing stack." That description fits 400 companies, and every one of them is qualifiable on day one.
This is where TAMI's combination of merchant detection, payment and shipping signals, and martech stack visibility tends to compress weeks of research into hours. The tool pairs naturally with the broader ideal customer profiling work most teams skip because manual research is too slow.
3. Account-based marketing
ABM is one of the most talked-about strategies in B2B, and 48% of businesses consider it effective. Its success fundamentally depends on technographic data, because ABM only works when your messaging genuinely addresses each target account's specific situation.
Without technographics, "personalisation" collapses into mentioning the company name in the subject line.
With technographics, you can run different sequences against the same list of 100 accounts, each one tuned to the specific tech stack and integration story relevant to that buyer.
4. Personalised outreach at scale
The middle ground between "spray and pray" and "fully manual research" is where technographic data does its quietest work.
A rep doesn't have time to research 200 accounts by hand, but they can run a single template that pulls in the prospect's CRM, marketing automation, and payment provider, then triggers different angles based on those values.
The result is outreach that feels researched without requiring the research time, which is exactly what makes email campaign optimisation work at scale instead of breaking when volume goes up.
5. Integration and partnership targeting
If your product integrates with specific platforms, technographic data identifies every prospect already running those platforms.
This is one of the cleanest qualification signals in B2B: a company already using the tools you integrate with is meaningfully more likely to convert than one that isn't.
The same logic applies to channel partnerships, where you can identify accounts running a partner's product and co-target them.
Where teams get technographic data wrong
The category has matured enough that "do you use technographic data" is the wrong question. The right question is "is yours actually usable?" Three failure modes show up consistently.
Lack of data depth
The first is surface-level depth. Knowing an account uses AWS tells you almost nothing, because so does most of the internet. Knowing they use AWS for compute, Aurora for database, and Lambda for serverless workloads tells you whether you have a fit.
Most generic data providers stop at the first level, which is why their technographic filters produce lists that are too broad to act on. TAMI's stack detection was designed around the second level, including the parts of the commerce ecosystem (payment providers, shipping carriers, merchant infrastructure) that other platforms don't index at all.
Data staleness
The second is staleness. Technographic data ages fast because companies change stacks constantly.
A quarterly crawl misses every install and uninstall that happened in between, which means every competitive displacement signal expires before you can act on it. Real-time refresh is the only model that keeps the signal current, and it's what separates technographic data that drives revenue from technographic data that drives a list export nobody opens twice.
This is exactly why teams treat their tech stack signals the same way they treat the rest of their CRM, with ongoing enrichment baked in. Our breakdown of B2B data enrichment for sales teams covers what that looks like operationally.
Missing context
The third is missing context. Knowing a company "uses HubSpot" without knowing whether they're on Starter or Enterprise is a meaningful gap.
Knowing they "use Stripe" without knowing whether they also use Adyen or Braintree changes the targeting story entirely. Technographic data that doesn't carry adoption depth, tier, and complementary tools is half a signal.
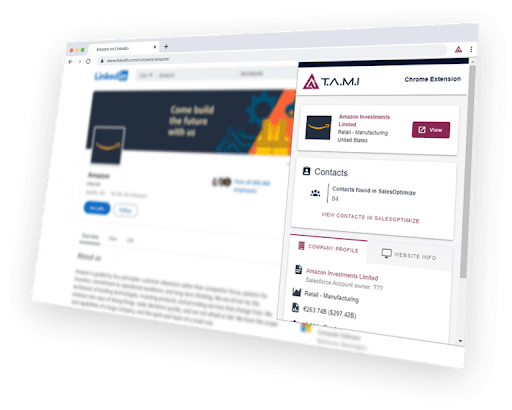
What good technographic data actually looks like
If you're evaluating providers or building this capability internally, four criteria matter more than the others.
Real-time refresh so the signal you're acting on is the signal that's true today. Anything quarterly or slower is a vanity asset.
Stack depth that goes beyond category labels to the actual tools, tiers, and complementary platforms. For commerce-adjacent motions, that means payment providers, shipping methods, BNPL, ecommerce platforms, and merchant traffic, not just "uses ecommerce software."
AI-based classification that replaces SIC and NAICS codes, which were never designed for modern technology businesses. This is the same gap that breaks classification in ecommerce prospecting, and the fix is the same: read the actual signals, not the legacy taxonomy.
Verified contacts paired with the technographic record, because a perfectly targeted account is worthless if your email bounces. TAMI keeps bounce rates under 5% by refreshing contact data alongside the technographic layer, which is what closes the loop between "identified the right account" and "started a conversation."
These four criteria are the reason TAMI's technographic layer holds a European patent for ecommerce merchant detection and consistently shows up in conversations about precision B2B targeting. The patent doesn't make the data better on its own. The underlying approach (real-time refresh, depth, AI classification, paired contacts) does.
Putting it into practice
A working technographic motion isn't complicated, but it's deliberate. Here’s how the top teams we support do it:
Define your ICP correctly
Start by writing your ICP technographically rather than demographically. Replace "mid-market SaaS" with the actual stack indicators that describe the companies you've sold into successfully (CRM, marketing automation, payment provider, hosting, observability, anything that defines them as the right fit).
Build a detailed list
Pull a list against those filters. Layer in install and uninstall signals to identify the prospects with the highest current intent. Pair each account with verified contacts at the relevant function. Build sequences that reference the specific stack rather than the company name.
Measure continuously
Then measure. Conversion lift from technographic targeting tends to compound rather than spike, which means the first month rarely tells you the full story.
By month three, the teams running this motion well are usually pulling away from peers who are still working with industry-and-size lists, and the data pipeline that feeds the whole thing becomes part of the operational stack rather than a side project.
For the broader view of how this connects to demand generation, our breakdown of a predictable B2B demand generation engine covers where technographic data plugs into the bigger system.
Final thoughts
Technographic data is the practical alternative to demographic guessing, and it pays out across competitive displacement, ICP refinement, ABM, personalised outreach, and integration targeting.
The teams winning with it are the ones whose data is fresh, deep, AI-classified, and paired with verified contacts. Everything else is a slower version of the same idea.
If your current targeting still leans on industry codes and company size, the gap between you and teams running on real technographic intelligence is widening every quarter. Book a demo of TAMI and see what real-time stack detection, AI-based classification, and verified contacts look like applied to the accounts you're already trying to reach.