
Sales territory planning software balances your CRM. We show you the market first.
Sales territory planning software splits the accounts you give it. None of it tells you what's missing. If your CRM holds a third of the UK market, you haven't built fair patches, you've divided a sample three ways.
TAMI AI maps 1.6 million UK companies by nation, region and city, classified by what each business actually does. Load that into your planning and every patch is measured against the real market rather than the accounts you happen to have collected.
1.6m UK companies. Every nation, region and city. Refreshed continuously.
No card needed. Count the companies in a patch before you assign it to anyone.
Two reps, same account count, completely different years.
One patch has 400 live companies that fit. The other has 400 records, half of them dormant, misfiled or already someone else's customer. Nobody finds out until the numbers land in Q3.

What is sales territory planning?
Sales territory planning is how you divide a market between reps so each one has a fair, workable patch. It's usually split by geography, industry, account size or named accounts, and it decides quota attainment, rep retention and how much of the market gets covered at all.
Sales territory planning software handles the mechanics: drawing boundaries, balancing workload, modelling scenarios and pushing assignments into the CRM. What it can't do is tell you what sits outside your CRM. Every one of those tools optimises the data you upload, which is why territory plans built on incomplete data stay unfair no matter how good the optimiser is.
Why territories end up unfair even after replanning
Three failures, all invisible until quota season.
You balanced your CRM
Planning tools split what you give them. If your database over-represents London, the optimiser will faithfully balance a distorted picture. TAMI AI supplies the full company universe per region.
Dead records inflate patches
A patch with 400 records, 90 of them dormant, looks identical to one with 400 live companies. TAMI AI reads live websites, so trading businesses are separated from ones that stopped.
SIC codes misfile accounts
Vertical patches built on SIC codes inherit every misclassification in the register. TAMI AI classifies from what a company does today, so vertical splits hold.
Plan against the market, not your database.
Real counts per region, dead records stripped out, classification that holds.
EQUAL ACCOUNT COUNTS ARE NOT EQUAL TERRITORIES
Two reps with 400 accounts each can be handed completely different years, and the plan will look balanced on the slide.
Density matters more than headcount here. A patch with fewer companies that all fit your ICP beats a bigger one padded with dormant records, and only one of those two facts shows up in a CRM export.
Count the real companies in any UK region before you carve it. The count is free.
WHAT OUR CLIENTS THINK OF TAMI AI





Which territories can you plan with TAMI AI?
Here are the top vertical patterns our customers plan around, and what the data shows in each.
-
Payments and fintech
Merchant density by processor and region, so patches match where the money is.
Explore payments → -
Ecommerce
Live trading merchants by platform and revenue band, dormant stores excluded.
Explore eCommerce → -
SaaS and tech
Companies running the tools you integrate with, mapped by region.
Explore SaaS → -
Logistics
Shippers by carrier, corridor and cross-border activity.
Explore logistics → -
Manufacturing
Regional clusters by digital maturity and systems in use.
Explore manufacturing → -
Retail
Multi-site and multi-currency operators, separated from single-location sellers.
Explore retail →
Coverage runs across England, Scotland, Wales and Northern Ireland, filterable to city level, so patch boundaries can follow the market rather than a postcode grid. Want to go global instead? You can do that too.
Three questions your CRM can't answer
One
How many companies that fit our ICP exist in each region, including the ones we've never touched?
Two
Which patches look balanced on account count but aren't, once dormant records come out?
Three
If we hire two more reps, where does the market actually support them?
Not a map. The market underneath it.
Every answer comes back as a count per region, a segmentation, and a company list with verified contacts, ready to load into whatever you plan in.
What you can build a territory on
Geography is one dimension. These are the others, and they're what make a patch genuinely comparable.
Nation, region and city
England, Scotland, Wales and Northern Ireland, down to city level.
Live trading status
Active businesses separated from dormant sites, so dead records stop inflating patches.
Verified company classification
What a business actually does today, read from its site rather than a filed code.
Size and revenue bands
Headcount and revenue, so enterprise and mid-market splits are defensible.
Technology and payments
Platform, processor and carrier, for patches carved by stack rather than by postcode.
Account density scoring
How many genuine ICP matches sit inside a boundary, not how many records.
Combine any of them.
Count every live UK merchant over £5m running a specific platform in the North West, then draw the boundary around the answer.
WE SUPPLY THE MARKET. YOUR PLANNER SPLITS IT
TAMI AI is not a mapping tool and doesn't try to be. It's the account universe underneath the plan: every live UK company, classified by what it does, counted by region, exportable into Salesforce, your planning platform or a spreadsheet. Planning tools are only as fair as the data you feed them, and that's the part almost nobody checks.

458M+
CONTACTS


REAL TIME
REFRESH


What comes back when you map a territory with TAMI AI
We don't give you a boundary file. Six things land in your hands, and every one of them is usable the same day.
- Company count per region The real number of businesses matching your ICP inside each boundary.
- Density comparison Patch against patch, so imbalance is visible before anyone is assigned.
- The company list Every business behind the count, exportable to your CRM or planning tool.
- Whitespace flags Companies in the region that appear nowhere in your CRM.
- Named decision-makers Verified contacts inside those accounts, so a new patch isn't a cold start.
- Repeatable definition Saved criteria you rerun next quarter to see how each patch has moved.
Where does TAMI's territory data come from?
From the open web, read directly. We don't resell databases or buy panel data. We crawl live websites, classify each business by what it does, and match those companies to verified contacts. All UK and EU data carries documented lawful basis and managed suppression.
How TAMI AI fits alongside sales territory planning software
Two platforms UK teams evaluate alongside us, and what each does best.
| Salesforce Maps | eSpatial | TAM AI | |
|---|---|---|---|
| Territories built from | Records in your CRM | A file you upload | 1.6m UK companies |
| Source of the account list | You supply it | You supply it | Included |
| Company classification | Inherited from your records | Inherited from your records | AI, read from live sites |
| Trading status detection | Not published | Not published | Yes |
| Coverage gaps found | Within your own data | Within your own data | Companies missing from your data |
| Filters beyond firmographics | Demographic overlays | Data you supply | Tech stack, payments, carriers |
| Verified contacts supplied | No | No | Yes |
| Market data refresh | No market data held | No market data held | Continuous |
| Coverage outside the UK | Your records only | Your records only | 71m companies, 458m contacts |
How to plan a sales territory in six steps
Count the market before you divide it
Establish how many live companies match your ICP in each region. Everything downstream inherits this number, so getting it from your CRM is where most plans go wrong. (TAMI counts 1.6 million UK companies by nation, region and city).
Strip out what isn't real
Dormant businesses, closed sites and duplicates make a patch look richer than it is. Because TAMI reads live websites rather than a register, businesses that have stopped trading are identified before they reach the plan.
Balance on density, not row count
Equal account numbers are not equal opportunity. Weight by how many companies genuinely fit, and by what they're worth. Filtering on size band, revenue band and technology gives you that weighting per patch.
Check coverage, not just fairness
A balanced plan can still leave whole segments untouched. Match your CRM against the full market and TAMI flags the companies sitting inside an assigned region that appear in nobody's pipeline.
Account for what's already sold
A patch full of existing customers is a different job from a patch full of net-new. Exports deduplicate against your CRM on import, so current accounts and open opportunities separate cleanly from the rest.
Rerun it quarterly
Markets move. Companies launch, close, re-platform and relocate. Save the patch definition in TAMI and rerun it next quarter to see exactly what shifted, rather than replanning from scratch.
A territory plan is only as fair as the data underneath it. Coverage, trading status, and classification decide whether the patches are balanced or just look balanced.
WHAT TEAMS DO WITH IT
 Count real companies per region before carving
- Compare patch density side by side
- Strip dormant records out of the plan
- Feed clean account lists into your planning tool
- Rerun counts each quarter to catch drift
- Set quotas against actual market size
- Show a rep the market behind their number
- Find the regions that support another hire
- Spot whitespace nobody is covering
- Defend a realignment with company counts
Most territory disputes are data disputes. Bring numbers to the next one.
THE ACCOUNTS NOBODY HAS BEEN ASSIGNED
Fairness gets all the attention in territory planning. Coverage quietly costs more, and nobody audits for it.
- Match your CRM against the full UK market. What fits your ICP, sits in an assigned patch and appears nowhere is whitespace.
- One logistics engagement matched at 99%, so the remainder was real. Stripe, USPS, Trustpilot and DHL plan this way.
NO CUSTOM DEVS. JUST PLUG IN
With TAMI AI, building a verified UK contact list takes minutes. Setup is instant. Data starts flowing straight away. Here's what TAMI AI integrates with:





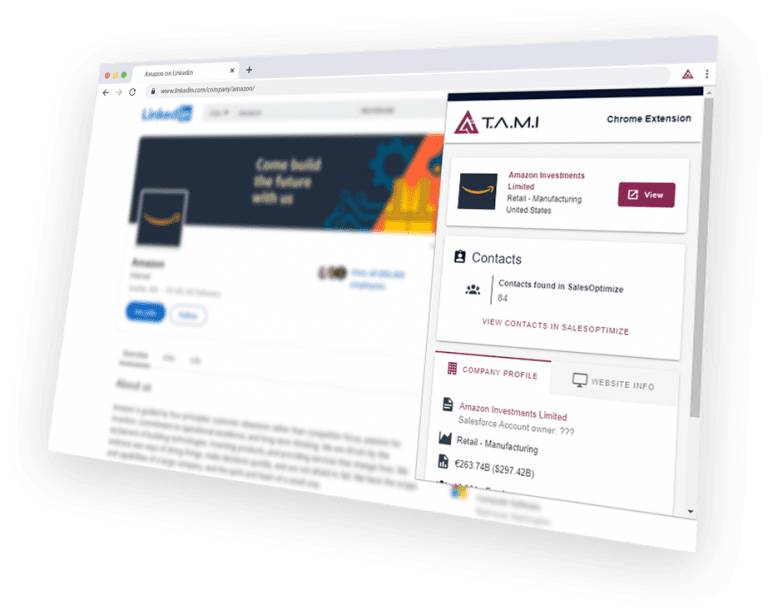
QUALIFY A COMPANY WITHOUT LEAVING THE TAB
Pull verified contacts, tech stack, payment providers and merchant data from any company site or social profile while you're already looking at it. Export straight to your CRM.
- Website
- Facebook
- Twitter
Send us your segment definition and we'll tell you how many UK companies match it, and how many are showing activity this month.
Explore more solutions
Every solution runs on the same UK dataset. Pick the problem you're solving today.
Frequently asked
questions
Stop dividing a database. Start dividing a market.
Count the live companies in every patch, see where the gaps are, and take the list with you.