
Firmographic segmentation data tells you a company's shape, not how it buys
Firmographic segmentation data starts with size, sector and location, and most segmentation stops there. Two UK retailers of the same size can run different platforms, take different payments and buy for different reasons. TAMI AI segments on what they actually do.
We read live company websites and classify each business by platform, payment provider, carrier, trading status and growth activity as well as the usual firmographics. Every attribute is a filter, so each segment comes back with a count and a list.
1.6m UK companies. Every attribute countable, every segment exportable.
No card needed. Define two segments and see how differently they actually look.
One contact per account is not account coverage.
B2B purchases of any size are decided by a group rather than a person, spanning the function that will use the product, the one that will integrate it, and the one that signs. Reaching one of them is a conversation, not a campaign.
What is market segmentation in B2B?
Market segmentation is dividing a market into groups that need to be approached differently, then deciding which of those groups to prioritise. It is not the same as choosing an ideal customer profile, which describes one best-fit group. Segmentation accepts that several groups are worth serving and that each needs a different message, motion or price.
The data decides how good the segments are. Firmographic segmentation data covers size, sector, location and revenue, and it is where nearly all B2B segmentation begins because it is the easiest information to obtain. The limitation is that firmographics describe a company's shape rather than its behaviour, and shape is a poor predictor of what a business buys.
Why most segments behave identically
Three failures, and all three produce segments nobody markets to differently.
Segments split on convenience
Size band and sector are used because the data exists, not because they differentiate. A mid-market retailer and a mid-market manufacturer share a bracket and nothing else.
No behavioural attributes
Nothing in a firmographic record tells you what a company runs, sells or ships, which is where the differences that matter actually sit.
Segments never got recounted
Companies grow, re-platform and change providers. A segmentation set at the start of a financial year describes a market that has already moved.
Segment on behaviour as well as shape. TAMI AI holds the operational attributes that make two segments genuinely different, and recounts them whenever you ask.
SAME SIZE, SAME SECTOR, DIFFERENT BUSINESS
A segment is only real if it needs something the others do not.
That is what makes segment-level messaging possible. A merchant running one checkout has a different problem from one running another, and that difference is invisible in any firmographic record.
Define two segments and see whether they actually differ. The count is free.
WHAT OUR CLIENTS THINK OF TAMI AI





How segments divide in your market?
Six verticals our customers segment, and the attribute that separates the groups.
-
Payments and fintech
Platform, checkout stack and verified trading status.
Explore payments → -
eCommerce
Platform share by revenue band, with migration direction over time.
Explore eCommerce → -
SaaS and tech
The tools a company runs, including what you would replace.
Explore SaaS → -
Logistics
Carrier relationships and the corridors actually served.
Explore logistics → -
Manufacturing
Digital maturity, from trade portals through to ERP.
Explore manufacturing → -
Retail
Currencies accepted, storefront count and international reach.
Explore retail →
Our European patent for merchant detection is what makes payment, checkout and fulfilment available as segmentation dimensions, and none of them appear in a firmographic file.
Three questions that test a segmentation
One
Would these two segments get the same email? If so, they are one segment.
Two
How many companies sit in each segment, exactly?
Three
What has changed in each segment since we last counted?
Not a framework. Segments with counts attached.
Every segment comes back as a count, an attribute breakdown and an exportable company list with verified contacts.
What you can segment on with TAMI AI
Firmographics are the first two. The rest are what make segments behave differently.
Size and revenue
Headcount band and revenue band across all four UK nations.
Sector and region
AI classification from live websites rather than a filed code, down to city level.
Technology stack
Platform, CMS, martech, analytics and hosting.
Payments and checkout
Processor, payment methods, currencies and BNPL adoption.
Fulfilment
Carriers used and destination markets served.
Trading and growth
Verified trading status plus hiring and expansion activity.
Combine any of them.
Every combination returns a count, so you can size a segment before deciding whether it deserves its own motion.
WE CLASSIFY BEHAVIOUR, NOT JUST SHAPE
Firmographic files inherit a sector code and a size bracket. TAMI AI reads the live website and classifies what each business actually does, which is why a segment defined by checkout provider or shipping corridor is available at all. Attributes stay current because sites are re-read continuously, and the fields are available through our data enrichment API.

458M+
CONTACTS


REAL TIME
REFRESH


What comes back from a segmentation
We don't hand you a framework and a blank grid. Six things arrive per segment.
- The company count How many UK businesses sit in the segment, updating as you adjust criteria.
- The attribute breakdown What the segment shares and where it splits internally.
- The company list Every business in the segment, exportable with firmographics attached.
- Named decision-makers Verified emails and direct dials inside each company.
- Overlap flags Companies qualifying for more than one segment, so definitions can be tightened.
- A saved definition Criteria you rerun next quarter to see how each segment moved.
Where does TAMI's segmentation data come from?
From the open web, read directly. We don't resell databases or licence third-party firmographic files. Every attribute is read from the live company website and classified with AI. All UK and EU data carries documented lawful basis and managed suppression.
How TAMI AI compares on firmographic segmentation data
Two platforms UK teams evaluate alongside us, and what each does best.
| Experian | Creditsafe | TAMI AI | |
|---|---|---|---|
| Firmographic segmentation | Yes | Yes | Yes |
| Credit and risk scoring | Yes | Yes | No |
| Corporate structure and linkage | Yes | Yes | Partial |
| Source of company classification | Registers and filings | Registers and filings | Live websites, AI classified |
| Technology stack attributes | No | No | Yes |
| Payments and BNPL segmentation | No | No | Patented |
| Carrier and fulfilment attributes | No | No | Yes |
| Verified trading status from the site | No | No | Yes |
| Verified contacts included | Limited | Limited | Yes |
How to segment a B2B market properly, in six steps
Start from the difference, not the data
Ask what would make you treat two companies differently, then find the attribute that captures it. Segmenting on whatever fields you happen to hold gets this backwards.
Test every segment against the message
If two groups would receive the same email and the same sales motion, merge them. Segment count is not a measure of sophistication.
Add behaviour to the firmographics
Platform, processor and carrier separate companies that size and sector group together. TAMI AI holds all three, which is where most segmentation gains sit.
Count each segment
A segment nobody sized is a hypothesis. The count updates as you adjust the criteria, so you find out before the plan is written rather than after.
Check the overlaps
Companies qualifying for two segments mean the definitions are loose. Overlaps are flagged, so you can tighten until each company has one obvious home.
Recount every quarter
Segments drift as companies grow and re-platform. Saved definitions make that a rerun rather than a project.
A segmentation is only as good as the difference between its segments. If the message does not change, the segment was a sorting exercise.
WHAT TEAMS DO WITH IT
 Build segments that justify different messages
- Size each one before committing budget
- Segment on stack rather than size band
- Export each segment as its own audience
- Recount as the market moves
- Prioritise segments by count and fit density
- Spot the segments nobody is covering
- Price and package against real segment sizes
- Hand each segment to the right team
- Track how segments shift quarter on quarter
A segment you cannot count is a guess with a name on it. See the real number behind yours, free.
SEGMENTS ARE ONLY USEFUL ONCE THEY ARE RANKED
Dividing a market is the easy half. Deciding which segment gets the quarter is the part that changes revenue.
- Because every segment comes back with a company count and an attribute breakdown, you can rank them on size, fit and how crowded each one already is.
- Stripe, United States Postal Service, Trustpilot and DHL use TAMI AI to understand how their markets divide.
NO CUSTOM DEVS. JUST PLUG IN
With TAMI AI, building a verified UK contact list takes minutes. Setup is instant. Data starts flowing straight away. Here's what TAMI AI integrates with:





QUALIFY A COMPANY WITHOUT LEAVING THE TAB
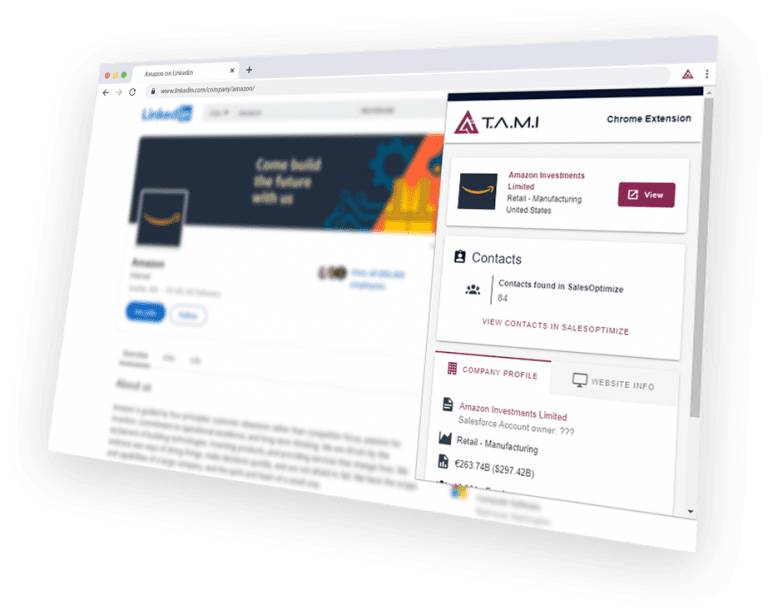
Pull verified contacts, tech stack, payment providers and merchant data from any company site or social profile while you're already looking at it. Export straight to your CRM.
- Website
- Facebook
- Twitter
Send us your segment definition and we'll tell you how many UK companies match it, and how many are showing activity this month.
Explore more solutions
Every solution runs on the same UK dataset. Pick the problem you're solving today.
Frequently asked
questions
Stop sorting companies. Start segmenting them.
Define your segments, see how many UK companies sit in each, and check whether they actually differ.