
A B2B market intelligence service that counts the market instead of estimating it
Most B2B market intelligence gives you a number in a slide and no way to act on it. TAMI AI counts the companies in your market, tells you what each one runs and sells, and hands you the list underneath the total.
We read live company websites across the UK, Europe and North America and classify each business by what it actually does. You get a market defined by observed activity, sized company by company, ready to hand to strategy or sales the same day.
1.6m UK companies. 108m EU contacts. 268m across North America.
No card needed. Run a market definition and see the count before you commit.
Traffic estimates go quiet exactly where B2B lives
Panel-based tools model traffic and stop reporting below a visits threshold, which is most of the B2B market. We count from company websites, so a 12-person manufacturer is as visible as a household name.

What is B2B market intelligence?
B2B market intelligence is knowing a market well enough to make decisions in it: how many companies it holds, what they buy and run, who serves them now, and which segments are worth entering. It underpins market entry, territory planning, product strategy and go-to-market.
It comes in two forms. Analyst reports interpret a market and give you conclusions. B2B market intelligence data gives you the company records, so your team defines the market its own way, counts it and acts on it. The second kind is the one you can still use six months later.
Why most market sizing doesn't survive contact with the plan
Three failures, all ending the same way: a number nobody trusts enough to hire against.
The market was badly defined
The ONS counts 2.73 million VAT or PAYE registered businesses in the UK, each carrying a code chosen at incorporation. Size a market on that and you include companies that pivoted years ago. TAMI AI classifies from live websites, so the data is always up to date.
The number was estimated
Top-down sizing multiplies an average by a population and produces a figure with no companies inside it. Traffic tools estimate from panels, and coverage thins below a visits threshold. TAMI AI counts each company individually, so the total is a list you can open.
It was accurate for a week
A report describes a moment. Six months on, the migrations and new entrants it missed are the ones that mattered. TAMI AI refreshes continuously, so you recount in minutes rather than commissioning again.
Get a market you can interrogate.
Defined by what companies do, counted rather than modelled, current on the day you look.
A NUMBER YOU CAN'T OPEN ISN'T INTELLIGENCE
Nobody hired a rep or entered a country on a TAM figure alone.
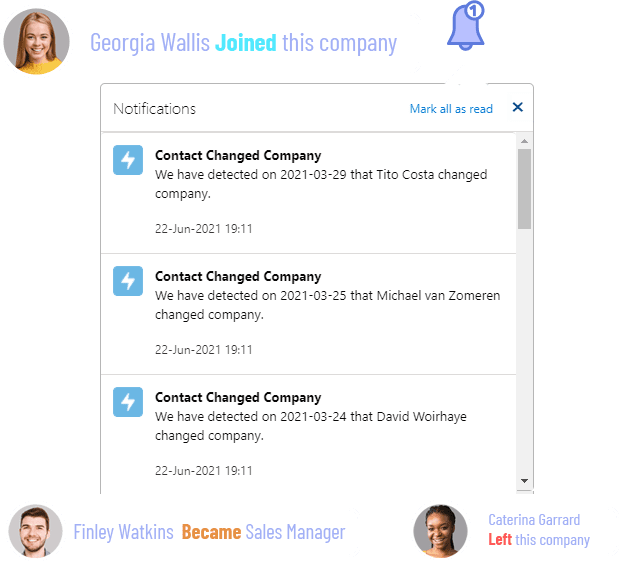
Sizing and acting stop being separate projects. The count in your board pack is the dataset sales works from next quarter, so the assumptions get tested rather than defended.
Define a market the way your team thinks about it, then see how many companies are in it. The count is free.
WHAT OUR CLIENTS THINK OF TAMI AI





Which markets can you size with TAMI AI?
Six verticals our customers count most, and what the data shows in each.
-
Payments and fintech
Merchants by processor, payment method and BNPL adoption.
Explore payments → -
Ecommerce
Platform share by revenue band, with migration direction over time.
Explore eCommerce → -
SaaS and tech
Every company running the tools you integrate with.
Explore SaaS → -
Logistics
Cross-border trade by carrier and destination corridor.
Explore logistics → -
Manufacturing
Digital maturity, from trade portals to ERP adoption.
Explore manufacturing → -
Retail
Multi-currency storefronts and international footprint.
Explore retail →
Our European patent for merchant detection makes the payment, checkout and cross-border counts possible. One Fortune 500 client used this data to enter the payments market and reach a top five position within three years.
Three questions no analyst report will answer
Every answer comes back as a count, a segmentation, and a company list.
One
How many UK businesses adopted a specific technology last quarter, which ones, and what did they run before?
Two
How big is the cross-border segment really, measured by companies actually shipping internationally?
Three
Which competitors serve which parts of the market, at what share, and which of their customers look like the ones we win?
Not a report. A dataset you can query.
Every answer comes back as a count, a segmentation, and a company list, ready for strategy, sales, or product without a second procurement round.
What you can count with TAMI AI
Firmographics describe a company. Our B2B market intelligence service describes what it does, and they turn a market size into a strategy.
Technology adoption
Ecommerce platform, martech, hosting, analytics and banking provider, per company.
Payments landscape
Processors, payment methods, currencies and BNPL, counted at merchant level.
Merchant verification
Genuine trading merchants, separated from sites that merely run a cart.
Cross-border trade
Who ships where, by carrier and destination, so expansion maths starts from evidence.
Competitive footprint
Which companies run which vendor, giving true installed-base share.
Market movement
Migrations, new entrants and provider switches, so you see direction of travel.
Combine any of them.
Count every UK merchant over £5m that changed platform last year and now runs a competitor's checkout, then open the list.
WE READ THE MARKET. WE DON'T MODEL IT
With TAMI AI, every company record is built by reading a live website, not by inferring behaviour from a traffic panel or inheriting a code from a register. That decides whether a small manufacturer in the Midlands appears in your market at all, and it's why our counts hold up when clients check them against companies they already know.

458M+
CONTACTS


REAL TIME
REFRESH

What comes back when you size a market with TAMI AI
We don’t give you a PDF with a range in it. Six things land in your hands, and every one of them is usable the same day.
- Total company count Built from individual records, not a top-down multiplication.
- Segmentation breakdown Region, size band, revenue band, technology and trading behaviour, all at once.
- The company list Every business behind the count, exportable. Sizing and targeting become one exercise.
- Technology and payments profile Adoption rates across the market, plus who sits on what.
- Named decision-makers Verified contacts inside those companies, for when analysis turns into action.
- Repeatable definition Saved criteria you rerun next quarter to measure change rather than re-estimate it.
Where does TAMI's market intelligence data come from?
We don't resell databases or buy panel data. Company records are built by crawling live websites and classifying each business with AI on what it publishes about itself, then matched to verified contacts. All UK and EU data is processed under documented lawful basis with source transparency and managed suppression.
How TAMI compares on B2B market intelligence data
Two platforms UK teams evaluate alongside us, and what each does best.
| Similarweb | BuiltWith | TAMI AI | |
|---|---|---|---|
| Primary unit measured | Website traffic | Website technology | The company |
| Coverage published | 1B+ websites | 673m websites | 71m company records |
| Method | Panel estimation | Site crawling | Site crawling plus AI classification |
| Visibility for low-traffic firms | Threshold applies | Good | Full |
| Technology detection | Partial | Extensive | Extensive |
| Payments and BNPL detection | No | Partial | Patented |
| Cross-border shipping data | No | No | Yes |
| Verified contacts included | No | Limited | Yes |
| Free access to test | Limited | Limited free lookups | Yes |
How to size a UK market properly, in six steps
Define the market by behaviour
Describe what the companies do, sell or run. Classification codes quietly include and exclude the wrong firms.
Count individually, then aggregate
A total built from named companies can be audited. A total built from an average can't.
Separate addressable from total
Filter to companies that could realistically buy, on size, region and technical fit, before anyone quotes a number.
Check who serves them now
Installed-base share tells you whether you're entering an open market or a displacement fight. Those need different plans.
Look at direction, not just position
Migrations and new entrants over recent quarters show where the market is going, which is the part that dates fastest.
Keep the list
The companies behind the number are your target list and territory plan. Throwing them away is how sizing becomes an annual expense.
Market size is only as good as its definition. Definition, count method, and refresh cycle decide whether the number survives the first challenge. With TAMI AI, you don’t have to worry about that.
WHAT TEAMS DO WITH IT
 Size a market before committing headcount
- Compare segments on real company counts
- Track technology adoption quarter on quarter
- Measure a competitor's installed base
- Test entry assumptions before the board paper
- Turn a market count into a territory plan
- Prioritise segments with the highest fit density
- Hand sales the companies behind the number
- Recount after a quarter to see what changed
- Feed sizing into pricing and packaging
Most market sizing gets checked once, after the budget is spent. Recount yours whenever you like, and see who moved
MEASURE MARKET SHARE BY WHO RUNS WHAT
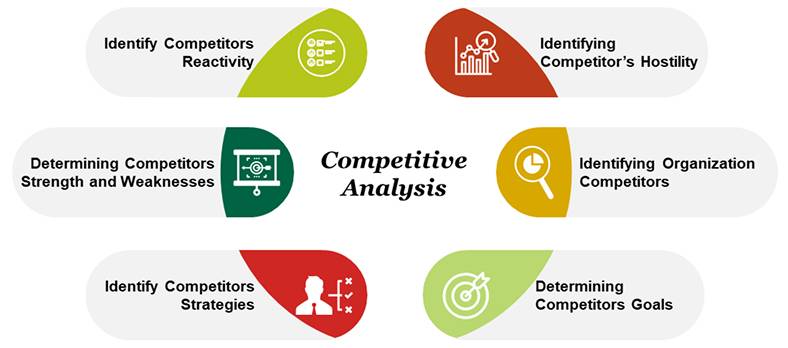
Reported share comes from vendors describing themselves. Detected share comes from reading which companies actually run which platform, provider and payment stack.
- With TAMI AI, you get the second kind, per competitor, per segment, per region, with the customer list attached.
- Stripe, United States Postal Service, Trustpilot and DHL use TAMI AI to size markets and understand where they stand in them.
NO CUSTOM DEVS. JUST PLUG IN
With TAMI AI, building a verified UK contact list takes minutes. Setup is instant. Data starts flowing straight away. Here's what TAMI AI integrates with:





QUALIFY A COMPANY WITHOUT LEAVING THE TAB
Pull verified contacts, tech stack, payment providers and merchant data from any company site or social profile while you're already looking at it. Export straight to your CRM.
- Website
- Facebook
- Twitter
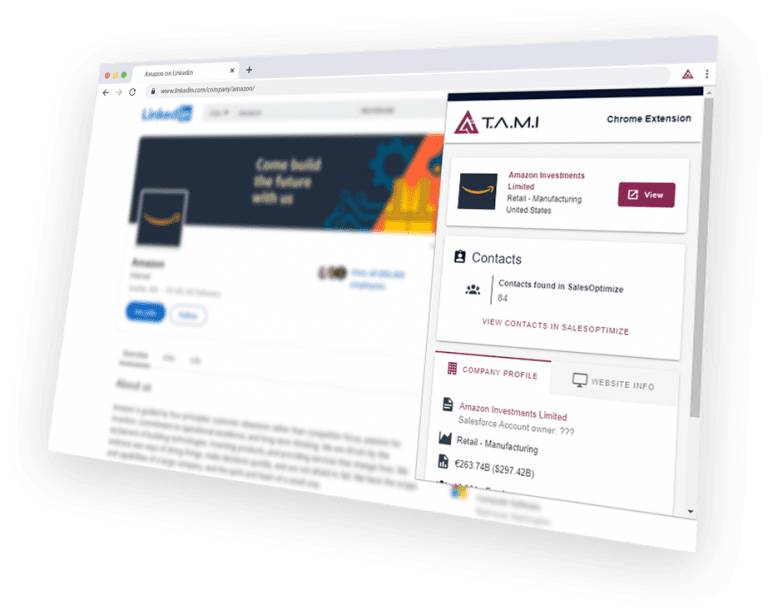
Send us your segment definition and we'll tell you how many UK companies match it, and how many are showing activity this month.
Explore more solutions
Every solution runs on the same UK dataset. Pick the problem you're solving today.
Frequently asked
questions
Stop presenting a number you can't open
Define your market, see the real company count behind it, and take the list with you.