
Build the right market entry strategy with reliable market expansion data in the UK
Every market entry strategy comes down to one question: which region to target first, with what budget and what team? TAMI AI can help you answer that, with the most reliable market expansion data in the UK, down to the companies you could actually sell to.
We read live company websites across the UK, Europe and North America and classify every business by what it sells, runs and ships. Candidate markets come back as company counts you can compare directly, with contacts attached.
108m EU contacts. 268m across North America. Every market counted the same way.
No card needed. Count two candidate markets before you commit to either.
You cannot sell to a market size.
A report telling you a market is worth £4 billion does not tell you how many businesses in it match your product, who they buy from now, or who to call in the first quarter. That gap is where entry plans stall.

What is a market entry strategy?
A market entry strategy is the plan for how a business enters a new market: which market to enter, how to serve it, and what it will take to win share. The mode matters, whether that is direct sales, a partner or reseller network, acquisition or a local entity, and each carries different cost, speed and control.
Most of the work goes into choosing between candidate markets, and that is where the data usually fails. Market expansion data tends to arrive as macro statistics: sector value, growth rate, competitive intensity. Useful for a board paper, useless for a rep. A strategy only becomes executable when it names the companies you intend to sell to.
Why entry plans stall after approval
Three failures, and all of them appear after the budget is signed off.
Sized differently
Two reports from different firms, years and definitions cannot be compared. TAMI AI counts every market from one dataset, so the numbers were produced by identical logic.
Nobody counted the slice
A sector worth billions may hold very few businesses that match your product. TAM AI counts the companies that fit rather than the value of the category around them.
No named buyers
A plan approved on macro numbers reaches the sales team without a single account. TAMI AI returns the companies behind the count, with verified contacts attached.
Compare candidate markets on the same basis.
Compare candidate markets on the same basis, count the companies that actually fit, and hand over the list. Our market expansion data for the UK region can help.
TWO MARKETS, ONE METHOD, ONE DECISION
Comparing two reports written by different people in different years is not analysis.
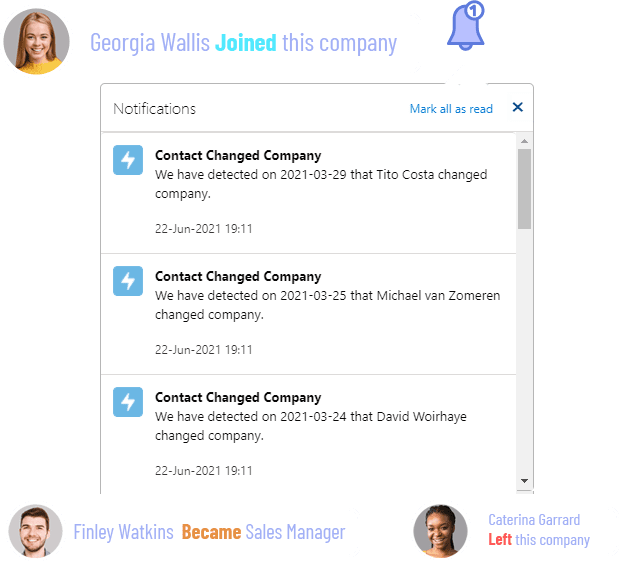
That turns a judgement call into arithmetic. You see which market holds more companies matching your profile, which is more crowded, and which has the infrastructure your product assumes.
Count two candidate markets side by side, on the same basis. The count is free, and our market data is reliable.
WHAT OUR CLIENTS THINK OF TAMI AI





In what niches can you find market expansion data?
We source data for many verticals our customers enter, and the signals that decide whether a market is ready.
-
Payments and fintech
Processor mix, BNPL adoption and merchant density per market.
Explore payments → -
eCommerce
Platform share and trading merchant counts, by revenue band.
Explore eCommerce → -
SaaS and tech
Adoption of the tools your product integrates with or replaces.
Explore SaaS → -
Logistics
Carrier relationships and live trade corridors between markets.
Explore logistics → -
Manufacturing
Digital maturity, showing which markets are mid-modernisation.
Explore manufacturing → -
Retail
Cross-border sellers and multi-currency operators per market.
Explore retail →
Our European patent for merchant detection makes payment, checkout and corridor data comparable across borders. One Fortune 500 client used it to enter the payments market and reach a top five position within three years.
Three questions to answer before you enter
One
How many companies in each candidate market match our ICP, counted identically?
Two
Who already serves them, and how much of the market do those incumbents hold?
Three
Does this market have the payment, platform and shipping infrastructure our product assumes?
Not a country report. A list you can act on.
Every answer comes back as a count per market, a segmentation and an exportable company list with verified contacts.
What decides whether a market is worth entering
Sector value tells you the prize. These tell you whether you can win any of it.
Companies matching your ICP
The real addressable count, not a percentage of a headline figure.
Incumbent presence
Which vendors already serve those companies, and how deeply.
Technology readiness
Whether the market runs the platforms and systems your product assumes.
Payment infrastructure
Processors, methods and currencies in use, which decides whether you can transact.
Trade corridors
Who ships where, showing existing commercial links between markets.
Direction of travel
New entrants, migrations and adoption shifts over recent quarters.
Combine any of them.
Compare two markets on identical criteria, then export the companies behind the better number.
WE COUNT COMPANIES. REPORTS COUNT MARKETS
A market report tells you a sector is worth billions and growing at a percentage a year. Neither number can be sold to. TAMI AI reads live company websites in each market and classifies every business by what it actually does, so the comparison runs down to the accounts your team would work in week one.

458M+
CONTACTS


REAL TIME
REFRESH


What comes back when you assess a market with TAMI AI
Our market expansion data doesn’t just include a country report with a forecast in it. Here are six things you get, all comparable across markets.
- Company count per market How many businesses match your profile in each candidate market.
- Like-for-like comparison Every market counted from the same dataset with the same classification logic.
- Incumbent mapping Which vendors and platforms already hold those companies.
- Infrastructure profile Payment providers, platforms and carriers in use across the market.
- The company list Every matching business, exportable with verified contacts attached.
- A repeatable definition Saved criteria you rerun in six months to see how the market moved.
Where does TAMI's UK market expansion data come from?
From the open web, read directly. We don't resell databases or licence third-party panels. Company records are built by crawling live websites and classifying each business with AI, then matched to verified contacts. All UK and EU data carries documented lawful basis and managed suppression.
How TAMI AI compares on market expansion data
Two platforms UK teams evaluate alongside us, and what each does best.
| Euromonitor | Statista | TAMI AI | |
|---|---|---|---|
| Unit of analysis | The market | The statistic | The company |
| Named companies returned | Brand shares only | No | Yes |
| Verified contacts included | No | No | Yes |
| Technology and platform detection | No | No | Yes |
| Payments and BNPL by market | No | No | Patented |
| Trade corridor data | No | No | Yes |
| Exportable target list | No | No | Yes |
| Refresh | Research cycle | Source-dependent | Continuous |
| Free tier | No | Yes | Yes |
How to choose a market to enter, in six steps
Shortlist on relevance, not on size
Start with markets where your product already fits rather than the largest available. TAMI AI shows which markets run the platforms and payment infrastructure your product assumes, before you commit to any of them.
Count each candidate identically
Apply one ICP definition across every market on your list. Because every company is classified from its live website using the same logic everywhere, counts from Berlin and Rotterdam are genuinely comparable.
Check who is already there
Vendor detection shows how much of each market an incumbent holds, so you can tell an open market from a displacement fight. Detected presence beats reported share every time.
Look for existing trade links
Corridor data reveals which markets already trade with your home market, and shorter sales cycles tend to follow existing commercial ties. TAMI AI detects carriers and destinations per company.
Pick the entry mode against the count
Four hundred matching companies suits direct sales. Forty thousand needs partners or channel. Run the count first and let it decide the mode, rather than deciding the mode and hoping.
Leave with the list
Export the companies behind the number with verified contacts attached. That is the step that turns an approved plan into a working territory, and it is the one most entry projects skip.
Entry decisions are made in a boardroom and won in a territory. The bridge between them is a list of companies, and most plans never build it.
WHAT TEAMS DO WITH IT
 Compare candidate markets on identical criteria
- Size the addressable slice, not the headline sector
- Measure incumbent presence before committing
- Test infrastructure readiness per market
- Recount after two quarters to check the thesis
- Hand sales the accounts behind the decision
- Prioritise markets with existing trade links
- Choose entry mode against real company counts
- Build the first territory before hiring into it
- Reach decision-makers from day one
Every quarter spent researching a new market is a quarter not selling in it. Count two candidates today.
THE EASIEST MARKET TO ENTER IS OFTEN THE ONE ALREADY BUYING
Businesses that already ship into a market have solved the logistics, tax and payment questions you are about to face.
- TAMI AI detects carriers, corridors and currencies from live company sites, so you can see which markets your target sector already trades with before choosing where to go.
- Stripe, United States Postal Service, Trustpilot and DHL use TAMI AI to understand where their markets sit.
NO CUSTOM DEVS. JUST PLUG IN
With TAMI AI, building a verified UK contact list takes minutes. Setup is instant. Data starts flowing straight away. Here's what TAMI AI integrates with:





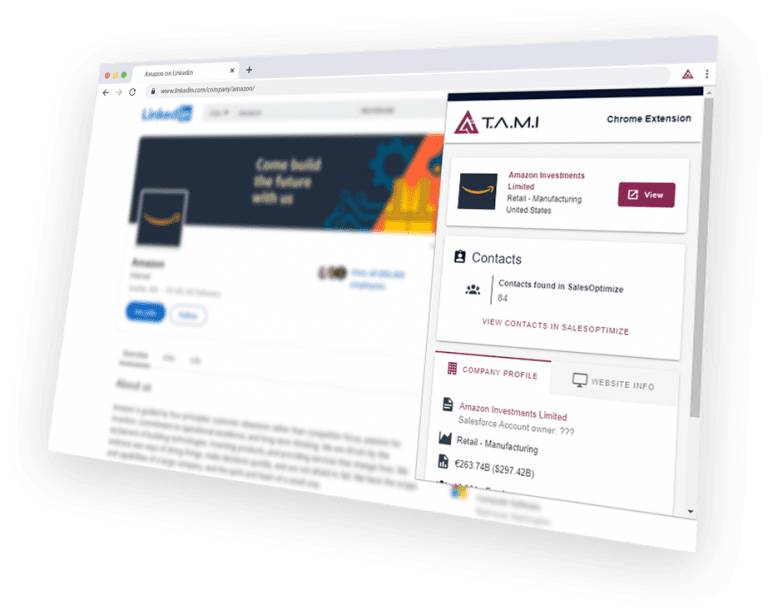
QUALIFY A COMPANY WITHOUT LEAVING THE TAB
Pull verified contacts, tech stack, payment providers and merchant data from any company site or social profile while you're already looking at it. Export straight to your CRM.
- Website
- Facebook
- Twitter
Send us your segment definition and we'll tell you how many UK companies match it, and how many are showing activity this month.
Explore more solutions
Every solution runs on the same UK dataset. Pick the problem you're solving today.
Frequently asked
questions
Stop entering markets you have only read about
Count the companies in every candidate market, compare them on identical criteria, and leave with the list.