
Go to market data that makes the plan add up
A GTM plan is a chain of numbers. Market size, ideal customer, segment sizes, quota, headcount. When each one is estimated separately from a different source, the plan contradicts itself long before anyone executes it.
TAMI AI counts every number in that chain from the same dataset. The market, the segments inside it, the companies matching your ICP and the accounts behind each territory all come from one set of records, classified the same way.
1.6m UK companies. 71m globally. Every plan number from one source.
No card needed. Count your market and your segments from the same dataset.
Your TAM and your quota model disagree.
One came from a report, one from a spreadsheet, one from the last board deck. Each is defensible alone and none of them reconcile, which is why the plan survives the meeting and not the year.
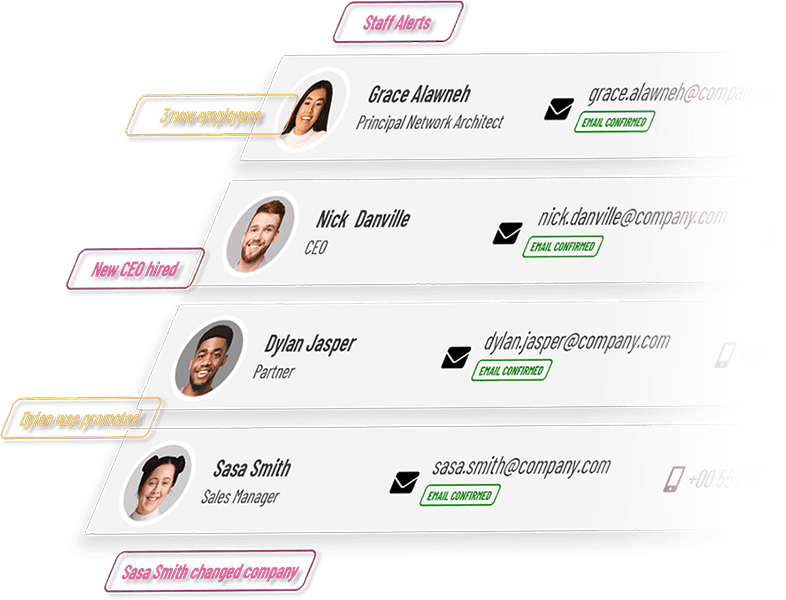
What is a go-to-market strategy?
A go-to-market strategy is the plan for how a business reaches and sells to its market: which customers to pursue, through which channels, with what message and pricing, and what resources it will take. It covers positioning, packaging, channel choice, sales motion and the commercial targets attached to each.
Underneath all of it sits a set of numbers, and this is where go to market data matters. How large is the market, how many companies match the profile, how do the segments divide, how many accounts does each rep need, what does that make the quota. Those figures are what the strategy is built on, and if they come from separate sources they will not agree.
Why GTM plans contradict themselves
Three failures, and they are structural rather than analytical.
Different sources
The TAM from a report, the segments from a workshop, the territory model from a spreadsheet. Each is defensible alone and none of them reconcile.
Nothing to open
A plan built on estimates has no companies underneath it, so nothing can be checked when the assumptions are challenged.
Set once, never recounted
Markets move within a quarter. A plan written in January is executing against a market that changed in March, with no mechanism to notice.
One dataset underneath every number. Market, segments, ICP and territories all counted the same way, so the plan reconciles and can be recounted whenever it needs to.
A PLAN THAT DOES NOT RECONCILE IS A WISH LIST
Each number can be right on its own and the plan still be wrong.
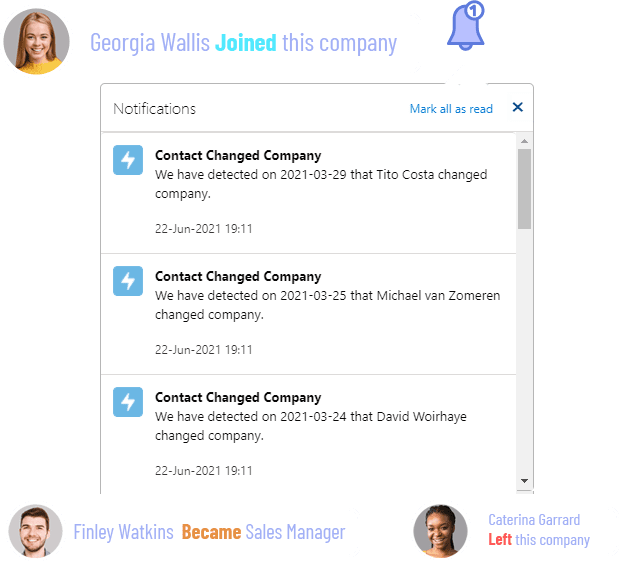
That is what makes a plan testable. If the quota assumes each rep works four hundred accounts, you can check whether four hundred exist in that patch before anyone signs up to the number.
Count your market and your segments from the same dataset. The count is free.
WHAT OUR CLIENTS THINK OF TAMI AI





What GTM planning needs in your market
Six verticals our customers plan against, and the data that grounds the assumptions.
-
Payments and fintech
Merchant density by processor and region, with BNPL adoption.
Explore payments → -
eCommerce
Trading merchant counts by platform and revenue band.
Explore eCommerce → -
SaaS and tech
Adoption of the tools your product integrates with or replaces.
Explore SaaS → -
Logistics
Carrier relationships and live trade corridors.
Explore logistics → -
Manufacturing
Digital maturity, showing which segments are ready to buy.
Explore manufacturing → -
Retail
Multi-site and cross-border operators, separated by footprint.
Explore retail →
Our European patent for merchant detection is what makes payment, checkout and fulfilment counts available as planning inputs. One Fortune 500 client used this data to plan entry into the payments market and reached a top five position within three years.
Three questions no analyst report will answer
One
Where did each number in this plan come from, and do they reconcile?
Two
How many companies are actually in the segment we have built the quota around?
Three
If the market moved this quarter, how would we know?
Not a framework. The numbers underneath one.
Every answer comes back as a count, a segmentation and an exportable company list with verified contacts.
What you can count for a GTM plan
Each of these is a number a plan usually estimates.
Total addressable market
Companies matching your definition, counted individually rather than modelled.
Segment sizes
How the market divides, with a count behind each segment.
ICP match volume
How many companies fit the profile your plan assumes.
Territory density
Accounts available per region, so patches can be built on real counts.
Incumbent presence
Which vendors already hold those companies, and how deeply.
Market movement
Migrations, new entrants and provider changes since you last counted.
Every count comes from the same records, so the numbers in your plan agree with each other by construction rather than by luck.
WE SUPPLY THE NUMBERS, NOT THE STRATEGY
TAMI AI does not write positioning, set pricing or choose channels. Those are decisions for your team and your advisers. What we supply is the layer underneath: every company in the market, classified from its live website, counted the same way at every level of the plan. Fields are available through our data enrichment API so the numbers can live inside your own planning models.

458M+
CONTACTS


REAL TIME
REFRESH


What comes back for a GTM plan
We don't hand you a template with blanks in it. Six things arrive from one dataset.
- The market count Total companies matching your definition, at national or regional level.
- The segment breakdown How that total divides, with each segment counted separately.
- The company lists Every business behind every number, exportable per segment.
- Named decision-makers Verified contacts inside those companies, so the plan reaches execution.
- Incumbent mapping Who already serves each segment, which shapes channel and message.
- Repeatable definitions Saved criteria you rerun each quarter to see what the plan is now executing against.
Where does TAMI's go to market data come from?
From the open web, read directly. We don't resell databases or licence analyst datasets. Every company record is built by crawling live websites and classifying the business with AI, then matched to verified contacts. All UK and EU data carries documented lawful basis and managed suppression.
What teams use instead of go to market data
Two platforms UK teams evaluate alongside us, and what each does best.
| Gartner | Forrester | TAMI AI | |
|---|---|---|---|
| Unit of output | Research and advisory | Research and advisory | The company |
| Named companies returned | No | No | Yes |
| Verified contacts included | No | No | Yes |
| Counts you can audit | No | No | Yes |
| Technology and payments detection | No | No | Patented |
| Same dataset across every plan number | Not applicable | Not applicable | Yes |
| Refresh | Research cycle | Research cycle | Continuous |
| Delivery into your own models | Reports | Reports | API |
| Free tier to test | No | No | Yes |
How to build a GTM plan on real numbers, in six steps
Count the market before you write anything
Every number downstream inherits this one, so it should be a count of real companies rather than a figure from a report nobody can open.
Define the ICP, then count it
A profile that returns too few companies cannot support the plan. TAMI AI returns the number as you adjust the criteria, so you find out at the definition stage.
Split the market into segments and count each
Segment sizes decide channel and message. A segment that turns out to hold forty companies needs a different motion from one holding four thousand.
Build the territory model from those counts
Accounts per rep should come from the same dataset as the market size, otherwise the quota and the TAM will not reconcile.
Check who is already there
Incumbent presence per segment decides whether you are educating a market or displacing a supplier, and the two need different plans and budgets.
Recount every quarter
Save the definitions and rerun them. A plan that cannot be recounted has no way of noticing that the market moved.
A GTM plan is a set of numbers that have to agree with each other. Getting each one from a different source is why so many plans stop making sense by Q3.
WHAT TEAMS DO WITH IT
 Count the market before the plan is written
- Reconcile TAM, segments and quota from one source
- Test ICP definitions against real volume
- Measure incumbent presence per segment
- Recount quarterly to catch drift
- Build territories on real account counts
- Set quotas the market can actually support
- Defend a headcount case with numbers
- Hand reps the accounts behind the plan
- Reach decision-makers from day one
Plans fail on arithmetic more often than on strategy. Check yours adds up.
THE PLAN AND THE TARGET LIST SHOULD BE THE SAME DATASET
Most GTM plans hand sales a strategy document and leave them to find the accounts.
- Because every count comes with the companies behind it, the segment you sized in the plan is the list your team works next quarter, with verified contacts attached.
- Stripe, United States Postal Service, Trustpilot and DHL use TAMI AI to ground their market planning.
NO CUSTOM DEVS. JUST PLUG IN
With TAMI AI, building a verified UK contact list takes minutes. Setup is instant. Data starts flowing straight away. Here's what TAMI AI integrates with:





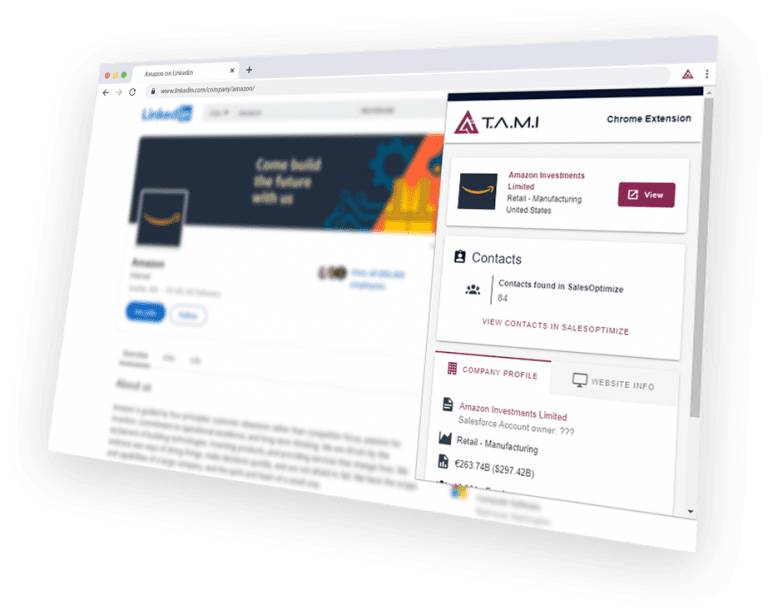
QUALIFY A COMPANY WITHOUT LEAVING THE TAB
Pull verified contacts, tech stack, payment providers and merchant data from any company site or social profile while you're already looking at it. Export straight to your CRM.
- Website
- Facebook
- Twitter
Send us your segment definition and we'll tell you how many UK companies match it, and how many are showing activity this month.
Explore more solutions
Every solution runs on the same UK dataset. Pick the problem you're solving today.
Frequently asked
questions
Stop planning on numbers nobody can open
Count your market, your segments and your territories from one dataset, and hand the plan to sales with the companies attached.